“We have a hard time recognizing that racial discrimination is the sole cause of racial disparities in this country and in the world at large … When you truly believe that racial groups are equal, then you also believe that racial disparities must be the result of racial discrimination.”-Ibram X. Kendi, Stamped From the Beginning
The idea that persistent outcome disparities between racial groups necessarily reflect or result from discrimination rests on a narrow, misleading, and politically motivated portrayal of the empirical reality. In what follows, I introduce and briefly discuss a number of data points that call this narrative into question.
Disparities between groups are the norm, not the exception—even among ‘whites’.
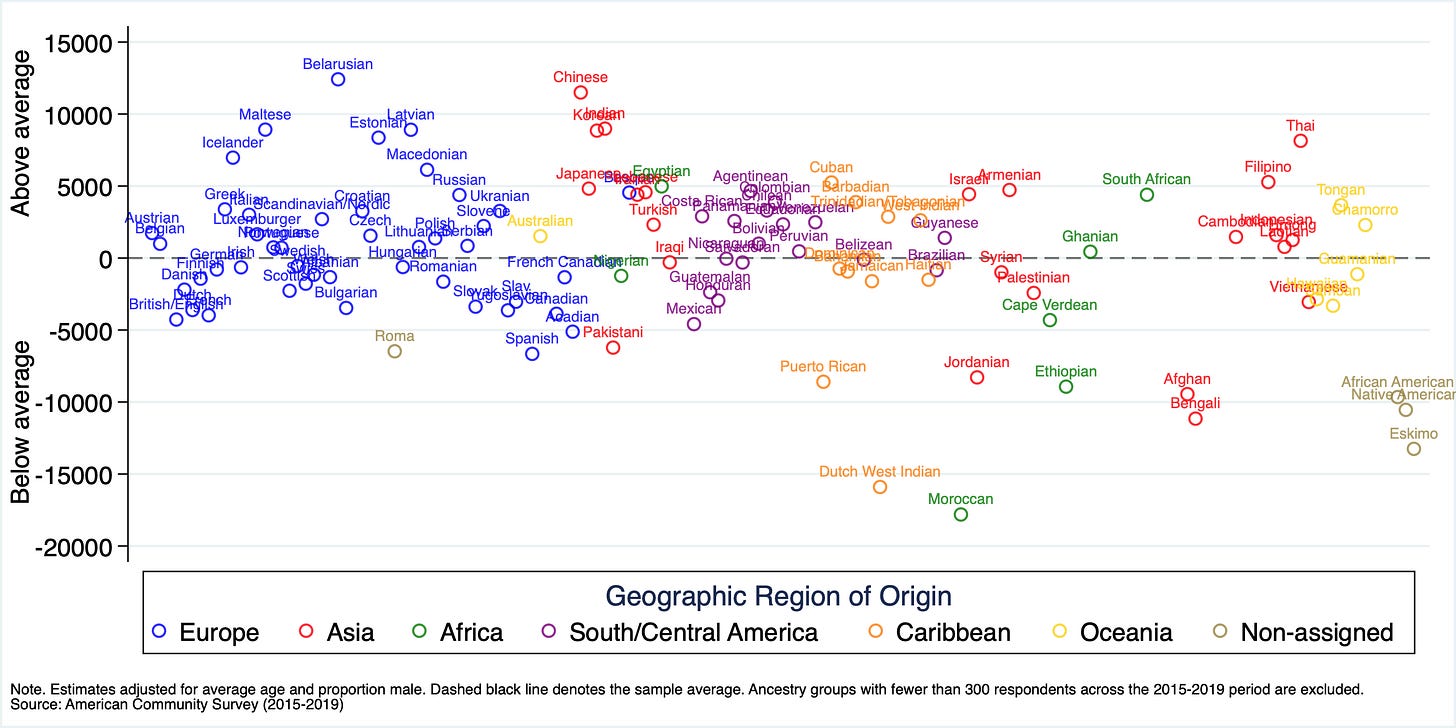
Binary white vs. black comparisons merely obscure disparities that obtain between virtually all ethnic/ancestry groups while promoting the illusion that white-black disparities are somehow exceptional. Indeed, large disparities in socioeconomic outcomes are observed even between US-born whites of different European ancestry. For example, Figure 1 below graphs the age and sex-adjusted median personal income among US-born respondents (so as to exclude the distortive influence of first-generation immigrants) by self-reported ancestry. Overall, nearly half (47.8%) of all European ancestry groups reported below-average median incomes in the 2015-2019 period, which is almost identical to the share (48.4%) among their non-European counterparts. Among the lowest US-born ‘white’ earners are those of Spanish, Dutch, Acadian, French, and British/English ancestry. Members of these groups had incomes that were comparable to those of most of their low-earning non-European counterparts. In the other (i.e. above-average) direction, US-born whites of Belarusian, Maltese, Latvian, and Estonian ancestry exhibit median outcomes that are rivaled by only those of Chinese, Indian, and Korean ancestry. Despite the fact that the five lowest-earning European ancestry groups hardly suffered any meaningful levels of historical oppression (if anything, those of ‘British/English’ ancestry were historically ‘privileged’), their average median personal incomes in 2015-2019 ($28,911) were around $15,110 lower than that of the four highest-earning European ancestry groups ($44,019). To put this into perspective, this gap approaches nearly twice the size of the median earnings gap ($8,272) between all European ancestry groups and African Americans.
Figure 1. Age/Sex-Adjusted US-Born Median Personal Incomes in 2015-2019
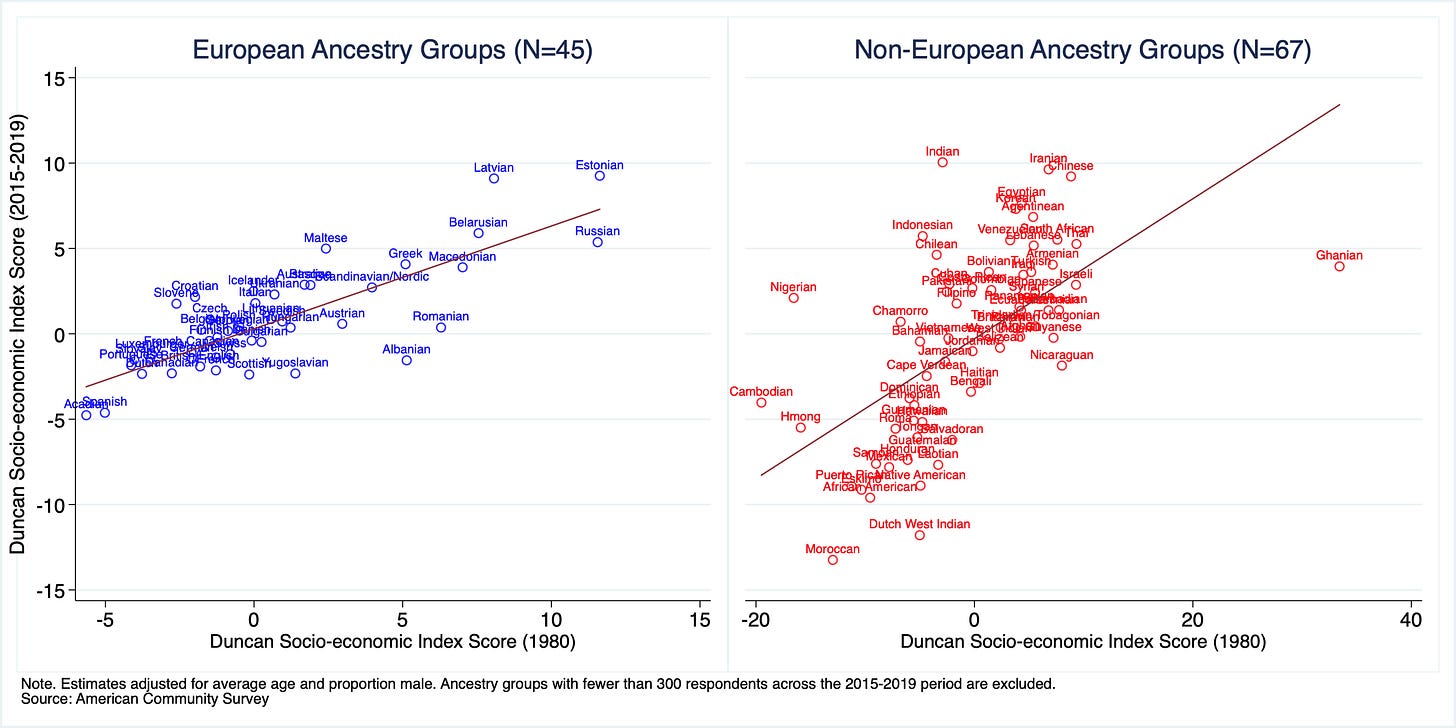
Unsurprisingly, the same or similar patterns appear in many other measures of socioeconomic status. Figure 2, for instance, shows the age/sex-adjusted US-born Duncan socioeconomic index score—a broad measure of socio-economic status— by self-reported ancestry. Once again, whereas US-born Americans of Latvian and Estonian (along with Indian, Chinese, Iranian) ancestry rank at the top, a number of European ancestry groups (e.g. French Acadian, Portuguese, Dutch) average socioeconomic scores that are either comparable to or not statistically distinguishable from members of most low-performing non-European ancestry groups. As was the case with earnings, the share (46%) of those with below-average socioeconomic index scores is identical for both European and non-European ancestry groups. If the US indeed constitutes a ‘white supremacist’ social system that is bent on maintaining European dominance, these data suggest it is failing miserably.
Figure 2. Age/Sex-Adjusted US-Born Duncan Socioeconomic Index Score in 2015-2019
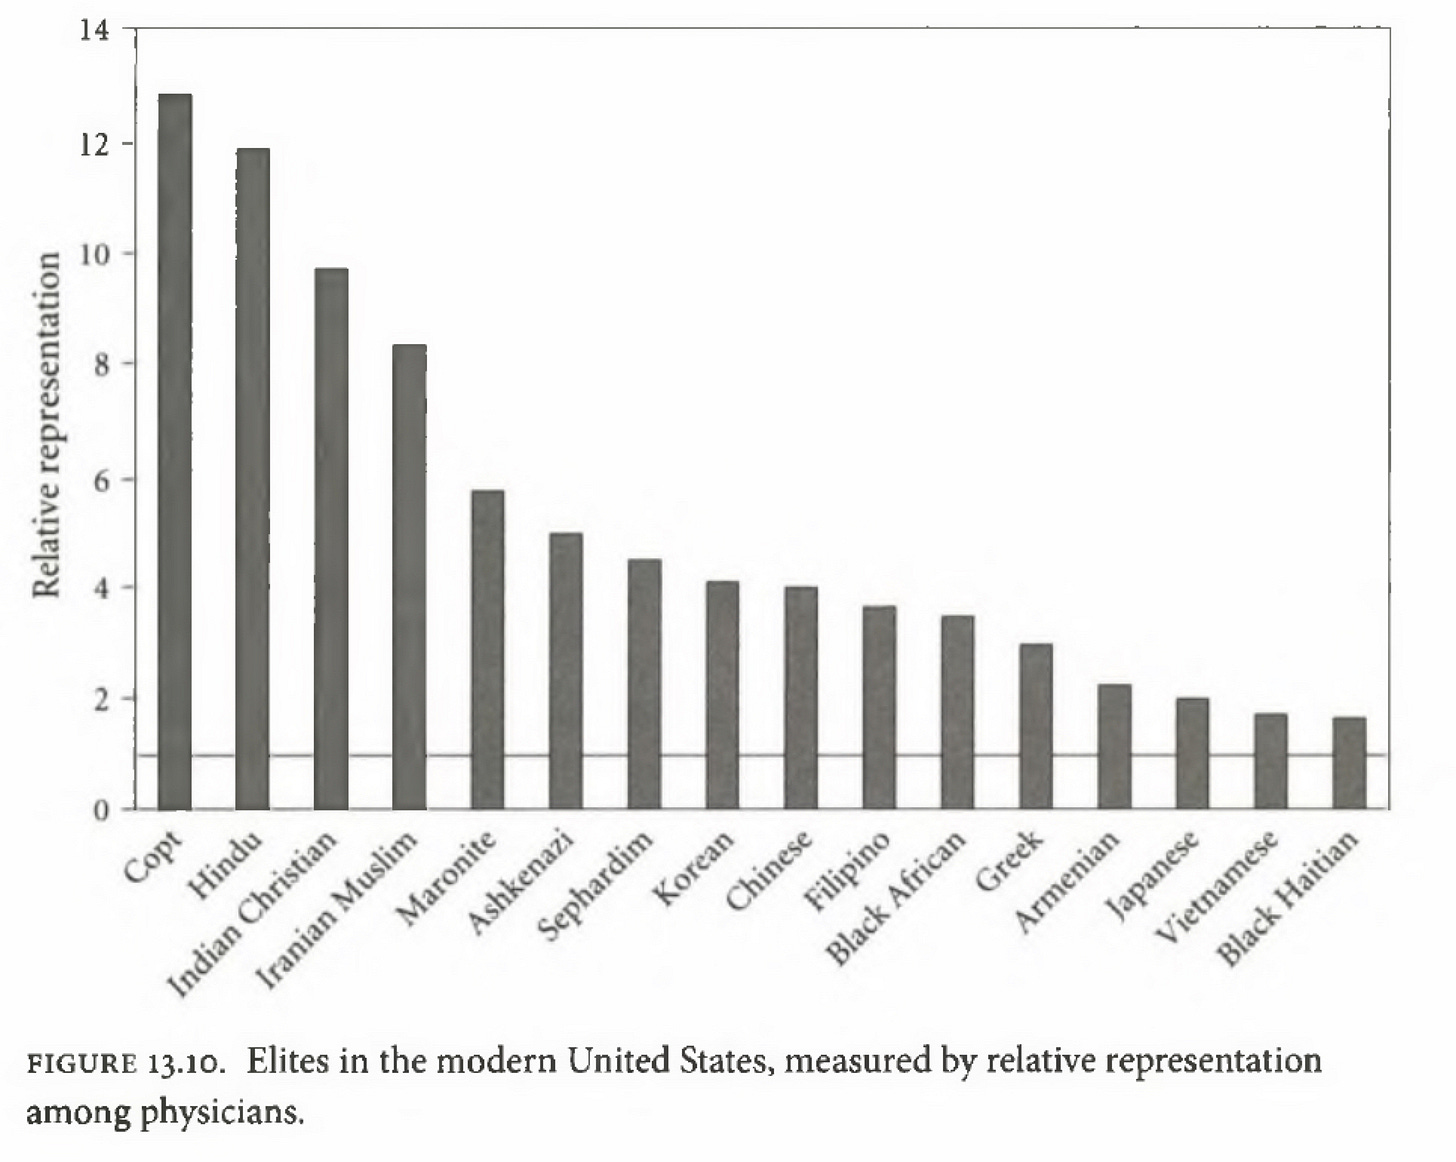
Studies using surnames to measure group social status similarly show large disparities between different European and non-European ancestry groups. For instance, Clark (2014) constructed a dataset of common surnames among different US ancestry groups to track their prevalence in prestigious professions across time. Figures 3 and 4 below, which were taken from Clark (2014), show the relative population representation of different group surnames among registered US physicians in 2000. Of the 16 ancestry groups whose surnames are overrepresented among physicians (Figure 5), nearly all are non-European. In contrast, of the 10 ancestry groups whose surnames are underrepresented, 4 are European.
Figure 3.
Figure 4.
Disparities between ancestry groups tend to be fairly persistent across time. And this persistence has no obvious connection to discrimination.
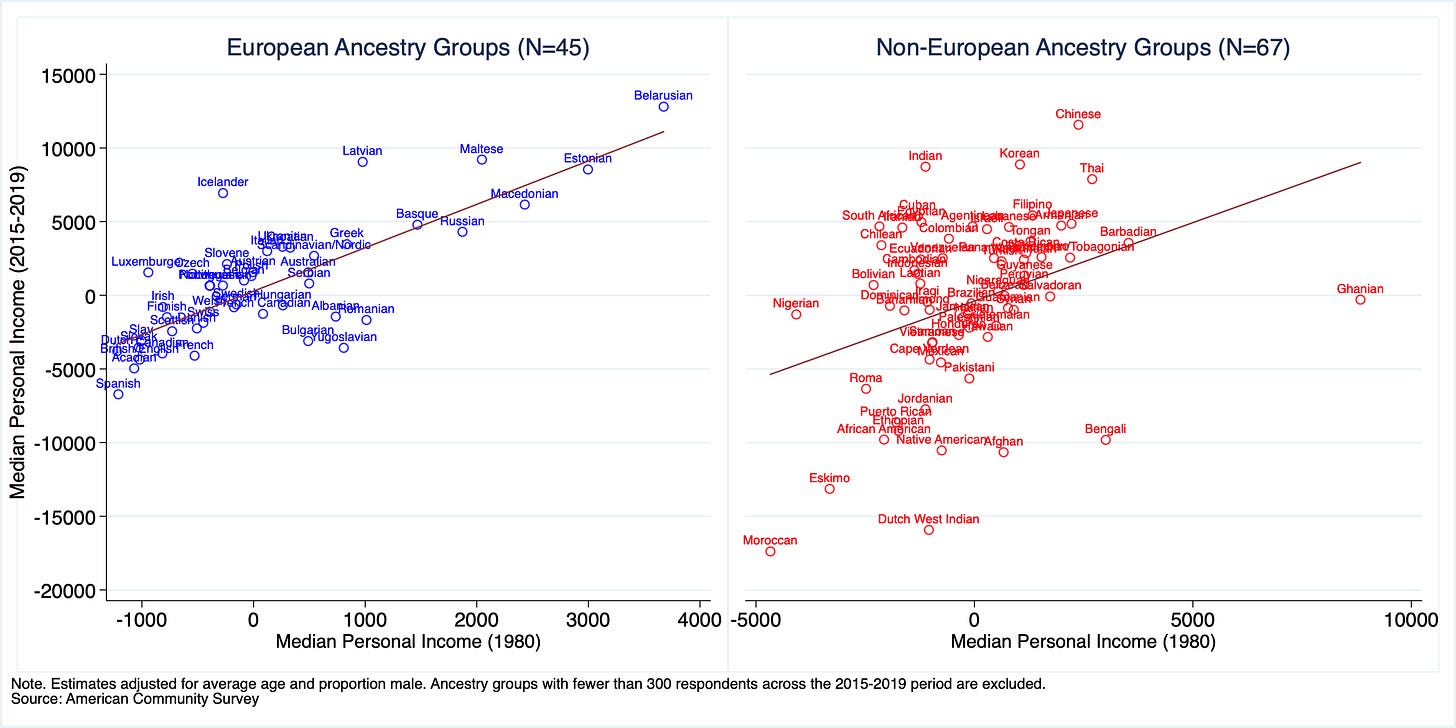
One might suppose that, absent systemic discrimination and bias, group outcomes will equalize over time. The data, however, tell a less optimistic story. Figures 5 and 6 show the relationship between median personal income and Duncan socioeconomic index scores in 2015-2019 vs. 1980. Generally speaking, and for those of European and non-European descent alike, how an average US-born member of an ancestry group fared in 1980 remains highly predictive of how an average member fared nearly 40 years later (i.e., in 2015-2019).
Figure 5. Age/Sex-Adjusted US-Born Median Personal Income in 1980 (X-Axis) vs. 2015-2019 (Y-Axis)
Figure 6. Figure 2. Age/Sex-Adjusted US-Born Duncan Socioeconomic Index Score in 1980 (X-Axis) vs. 2015-2019 (Y-Axis)
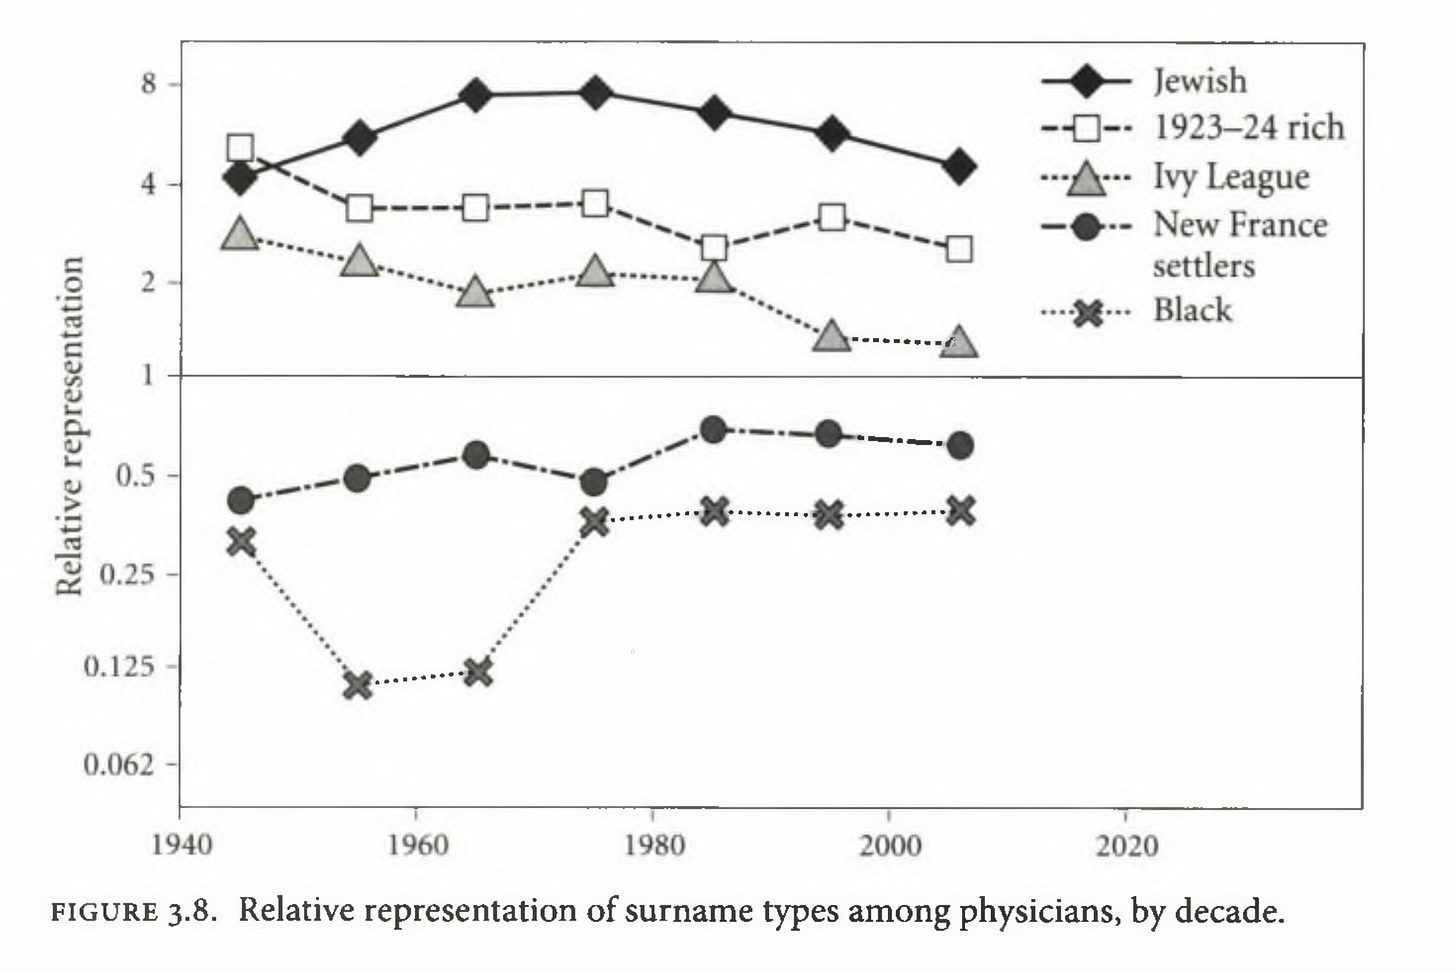
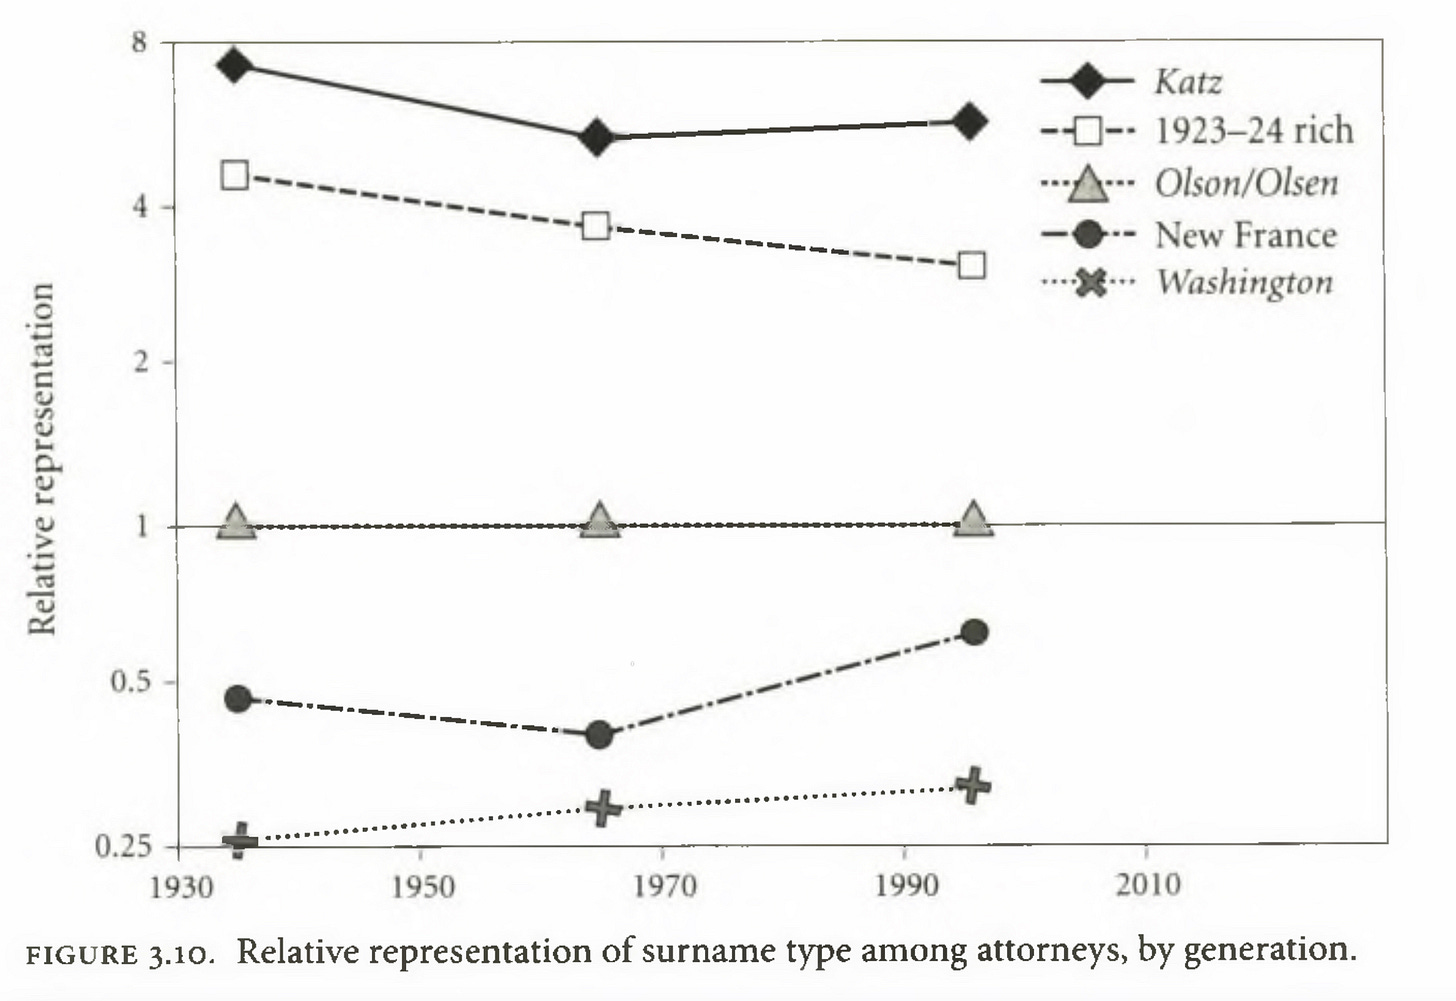
Clark (2014), whose data goes back even further than 1980 (as far back as the 12th century in some countries), similarly finds a remarkable degree of intergenerational stability in the social status of different ancestry groups. For instance, Figures 7-8 shows that Jewish (e.g. Cohen, Goldman, Katz) surnames were roughly as overrepresented among US physicians and attorneys in the 1940s-1950s as they were in the 2000s. Similarly, but in the other direction, ‘New French’ (which includes Americans of Acadian and French Canadian ancestry) surnames were nearly as underrepresented among US physicians and attorneys in the 2000s as they were 60-70 years earlier. In fact, across the entire period of the data, New French surnames (e.g. Herbet, Cote, Gagnon) were not much more represented than those common among African Americans (e.g. Smalls, Cooks, Washington).
Figure 7.
Figure 8.
Racial disparities in socioeconomic outcomes typically disappear when controlling for differences in cognitive ability.
Decades of research have shown measures of cognitive ability to be the single best predictor of important life outcomes, including educational attainment, earnings, job performance, and criminality (Gottfredson, 1997b; Jensen, 1998; Strenze, 2015; Warne, 2016a). Studies of identical twins and adopted children and, more recently, genome-wide association studies have also established that cognitive ability is highly heritable (i.e., an estimated 60-80% of the variation therein is due to genetic inheritance) and thus causally influences subsequent life outcomes (Bouchard Jr., 1998, 2013; Plomin, 2014). Because racial/ethnic groups tend to differ on measures of cognitive ability (with Ashkenazi Jews scoring highest on average, followed by Asians, whites, Hispanics, and African Americans), it follows that controlling for these differences will moderate if not eliminate socioeconomic outcome disparities between racial/ethnic groups. I demonstrate this below with data from the National Longitudinal Survey of Youth (NLSY), which has been tracking two large and racially diverse cohorts of Americans since 1979 and 1997, respectively.
Figure 9 graphs the predicted probabilities of attaining a Bachelor’s degree or higher among white, black, and Hispanic panelists. In the graph on the left, we see that, when controlling only for age, white panelists complete BA+ degrees at more than twice the rate of their black and Hispanic counterparts. However, and turning now to the graph on the right, when additionally controlling for cognitive ability, Hispanic panelists are just as likely to attain BA+ degrees as whites, while black panelists are now twice as likely to attain degrees as both groups (which may reflect the influence of affirmative action policies).
Figure 9.
Similar patterns are observed for personal incomes. As shown in Figure 10, when controlling only for age and sex, US-born white panelists earn, on average, over $24,000 and $15,000 more than their black and Hispanic counterparts. When additionally controlling for cognitive ability, though, these disparities are all but eliminated.
Figure 10.
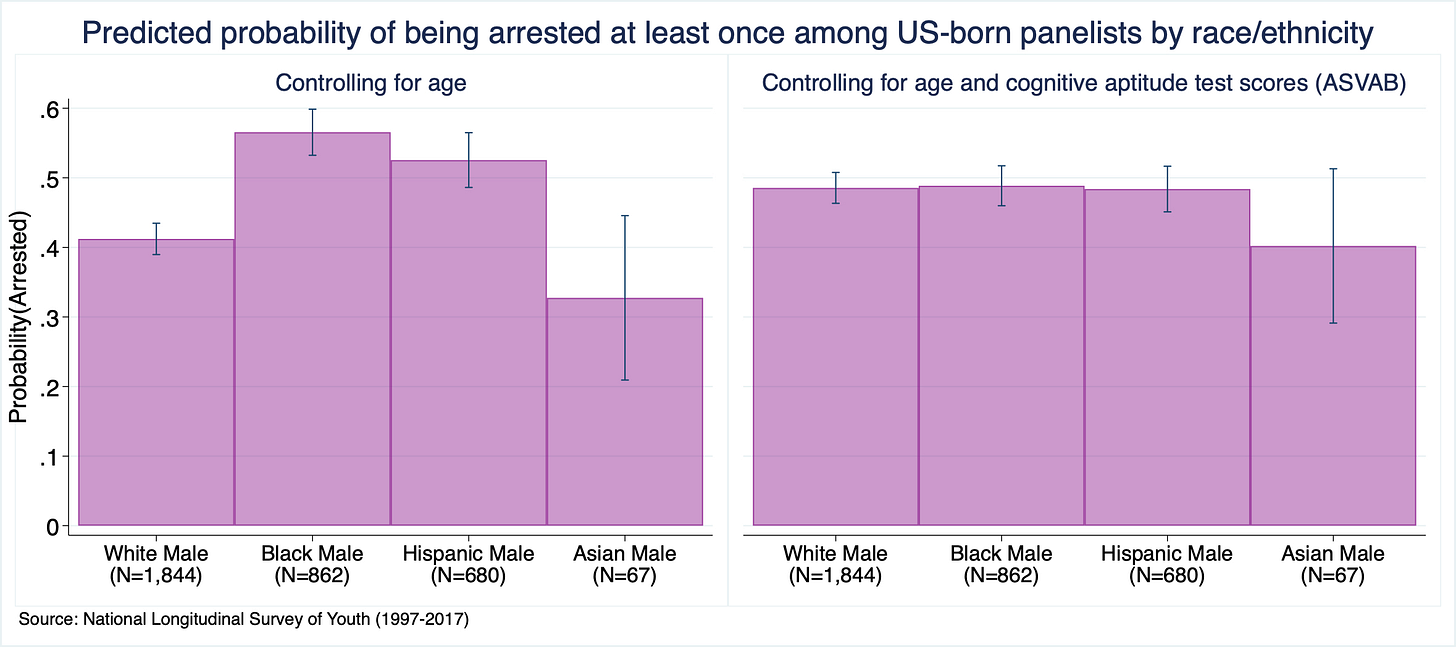
Figure 11 presents data from the 1997 cohort (born 1980-1984) of the NLSY, as arrest histories were not measured for the 1979 cohort. In the left graph, which controls only for age, we see that US-born black and Hispanic male panelists were significantly more likely than their white and Asian counterparts to be arrested at least once. But, these differences all but evaporate when controlling for cognitive ability.
Figure 11.
Figure 12 shows that this pattern extends to disparities in incarceration. Once again, controlling for age and cognitive ability, white, black, and Hispanic male panelists experience incarceration at statistically indistinguishable rates, while rates for Asian men remain significantly lower (apparently, one is better off Asian than white in our ‘white supremacist’ society).
Figure 12.
These findings are hard to square with the claim that outcome disparities between racial groups are necessarily a reflection of ‘systemic racism’. For in a systemically racist society, blacks, Hispanics, and whites of equal ability should still be treated and fare differently. Instead, and with the exception of a seeming pro-black advantage in BA+ degree attainment, we find that their life outcomes are statistically indistinguishable from one another.
4.Conclusion: Group disparities ≠ discrimination
The data presented here poses challenges for the notion that outcome disparities between racial groups necessarily signify discrimination. First, if large outcome gaps can endure between groups—including between different European ancestry groups—even in the absence of discrimination, how can it be concluded that those between whites and African Americans are entirely or even mostly the product of discrimination? On what basis can we be confident that their outcomes would equalize in the absence of discrimination when outcomes are far from equal between groups that hardly faced discrimination? Next to which group(s) would African Americans have placed in Figures 1-2 if not for ‘systemic racism’? French Canadians? Portuguese? Russians? Hell, why not the Chinese or Indians?
Second, if African Americans are systemically penalized on account of their race, why does this ostensible bias vanish when controlling for cognitive ability? More specifically, why do whites and African Americans of the same ability level have statistically indistinguishable life outcomes?
Of course, many of these questions can be avoided by narrowly focussing on the disparities between whites and African Americans and ignoring all the rest; and/or by examining racial disparities without controlling for important confounding variables. This is what proponents of ‘systemic racism’ theory typically do, and it is at least partly what makes the narrative so compelling (if superficially so).
But the truth is that group disparities are likely inevitable in any genetically and culturally diverse population. And this is especially likely to be the case in countries like the US, where immigrant groups (voluntary and involuntary) have typically varied in how they compare (in terms of ability, skills, education etc.) to the average person in their populations of origin. The point is not that discrimination can’t contribute to disparities, but that large disparities exist, emerge, and persist even in its absence (we only don’t pay attention to them because the ancestry groups in question were never or are no longer politicized). The upshot is that it may be impossible to determine the relative contribution of discrimination to disparities. As such, the claim that disparities between whites and African Americans are entirely the product of discrimination (or the fault of ‘white people’) is essentially unfalsifiable and should have no weight in determining public policy. Likewise, the assumption that lingering effects of historical discrimination must matter because we’re not far removed from segregation is also dubious. Those who hold this assumption need to ask themselves: at what point can we finally say that we’re far enough removed from Jim Crow that it no longer exerts a meaningful influence on the outcomes of African Americans? If the answer is ‘when outcomes between them and whites have equalized’, then you’re effectively committing to a standard that may not be possible to meet (and not for want of trying, but for much the same or similar reasons that it isn’t met between the Dutch and Chinese). And anything short of equality of outcomes will always be taken as ‘evidence’ that the effects of systemic racism are still operative.
To be sure, none of the above entails that nothing can or should be done to address the consequences of inequality and improve the quality of life for all. It only means that, rather than pointlessly obsessing over group disparities and blaming and penalizing groups that ‘do too well’ to artificially uplift those that don’t, we should focus on raising the floor for everyone. And this entails catering to the needs NOT of ancestral groups, but of individuals—be they of Dutch, Acadian, or African ancestry.







I've been following you on Twitter for a while and your patient approach to data mining is greatly appreciated. Many of us are exploring the question of why the world is the way it is with an open mind and data like this is of genuine interest.
The Cajun name is spelled Hebert, not Herbet.