Introduction
A friend of mine has generously shared with me data from the Cato Institute’s August 2021 Social Moderation Survey, which was administered by YouGov. Naturally, I couldn’t help myself, and I immediately dove right into it and started making graphs of some of the many interesting items that were fielded in this study. Rather than Twitter-thread them, I’ve opted to dump them here (for ease of future retrieval or reference). But due to a lack of time, this presentation is almost exclusively descriptive and bivariate in nature—multiple regression models, tests of interaction etc. will perhaps be left for a future article.
(Before I begin, a brief methodological note: unless otherwise stated, all of the items depicted below begin by asking respondents ‘How should social media sites handle users who [insert censorable act]?’. Respondents then select from one of 5 options, the frequencies of which are graphed over a 3-category measure of ideological self-placement. The full sample technically consists of 2,000 respondents. However, items were randomly assigned to respondents in sets of 5; that is, each respondent received/answered 5 of 22 items (this was conceivably done to limit respondent fatigue and/or cross-contamination of item responses). Accordingly, the sample sizes for each individual item naturally fall well short of 2,000 and are typically in the 130-200 range for each ideological group. The precision/uncertainty of each group estimate is denoted by the error bars. All data are weighted so as to be representative of the US population at large. Finally, I’d like for you all to be able to replicate all of the figures/analyses below. But because this dataset was not (AFAICT) publically released by Cato, and was only shared with me by a person who works there, I will first need to ask for permission before uploading and sharing it with all of you. If I receive the green light, I will update this article with a link from which the data can be downloaded).
Data
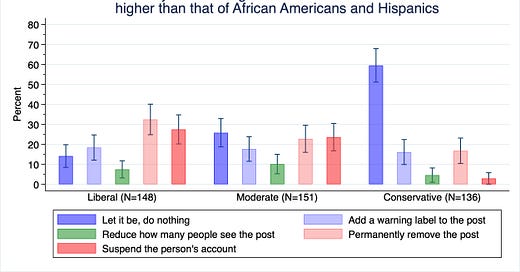
The first item that caught my attention asks about the preferred social media site response to a user who says that the “average IQ of whites and Asians is higher than that of African Americans and Hispanics”. Examining responses by ideology, roughly 60% of liberals (vs. ~46% of moderates and ~20% of conservatives) think that social media sites should either permanently remove the post (32.5%) or suspend the person’s account (27.5%). Just 14.2% (vs. ~28.2% of moderates and ~59.5% of conservatives) felt that such a post should be left as is. Let this sink in: a clear majority of liberals want to either prevent or silence the digital utterance of an empirical fact (which holds regardless of what one thinks of IQ tests). Then again, considering that many liberals either don’t think white IQ scores are higher on average than those of blacks or don’t think there are any racial differences in IQ scores, perhaps they only want to prevent the spread of what they perceive as ‘misinformation’.
Figure 1. ‘How should social media sites handle users who…’
Note. Data are weighted.
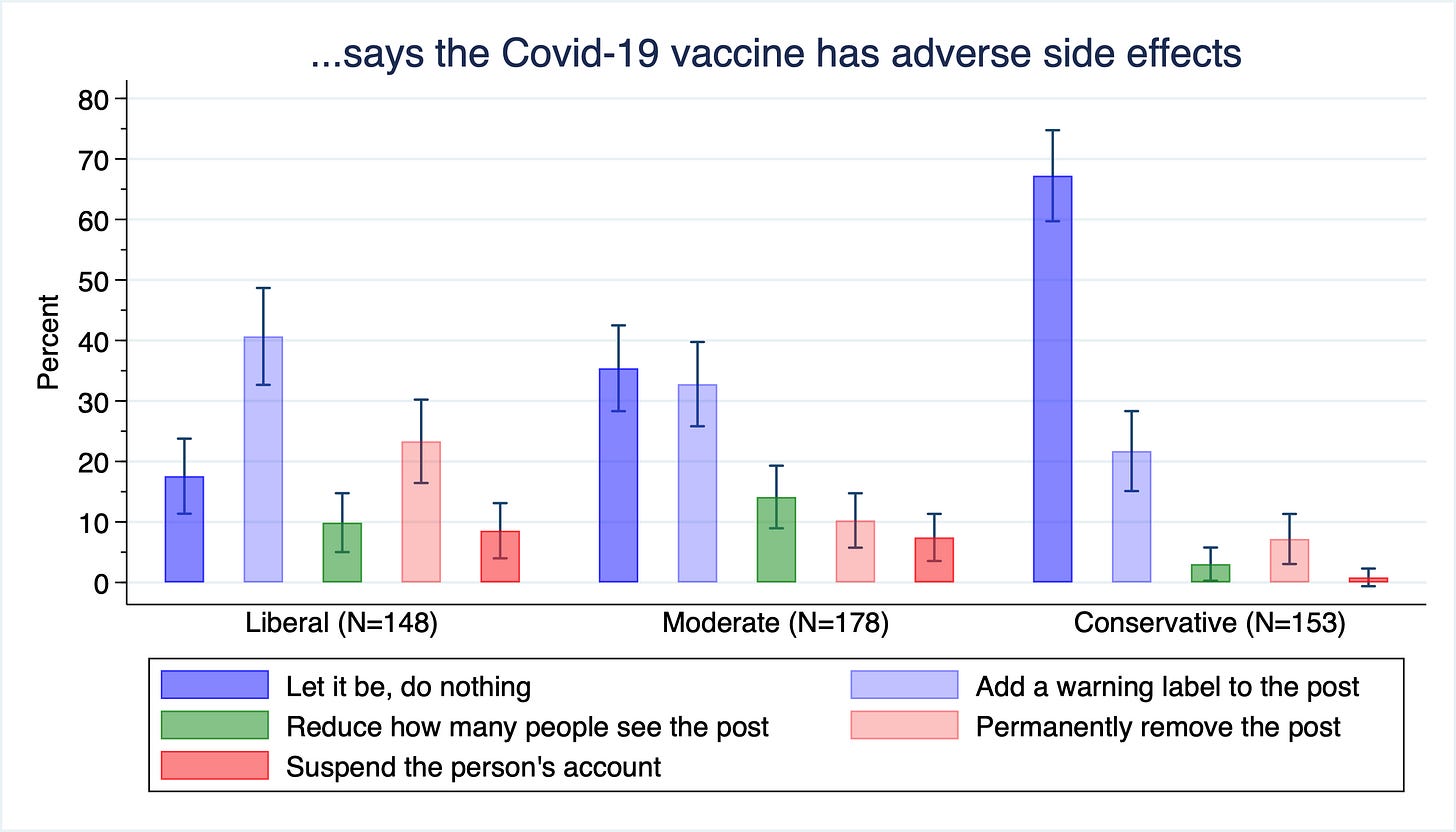
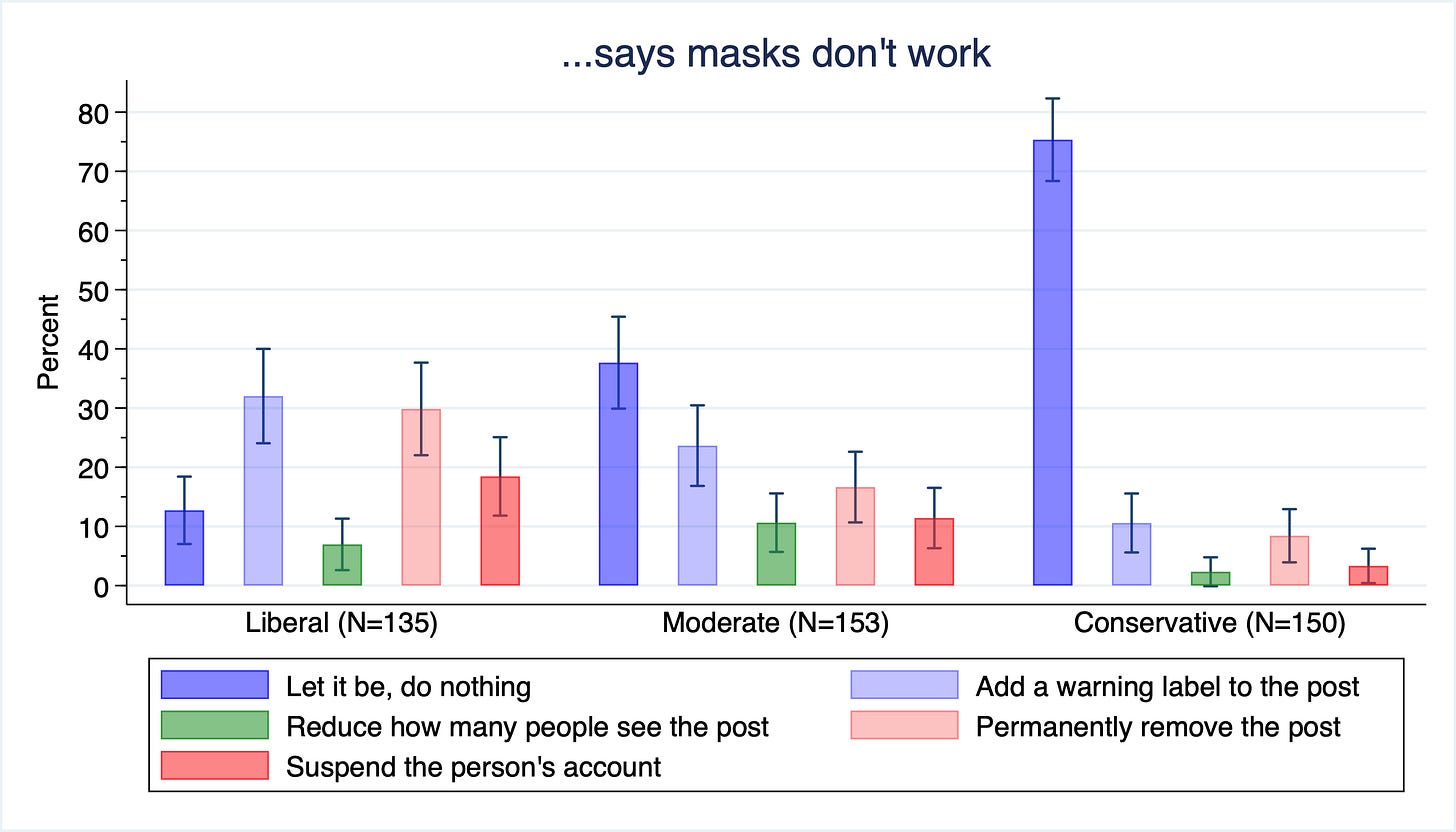
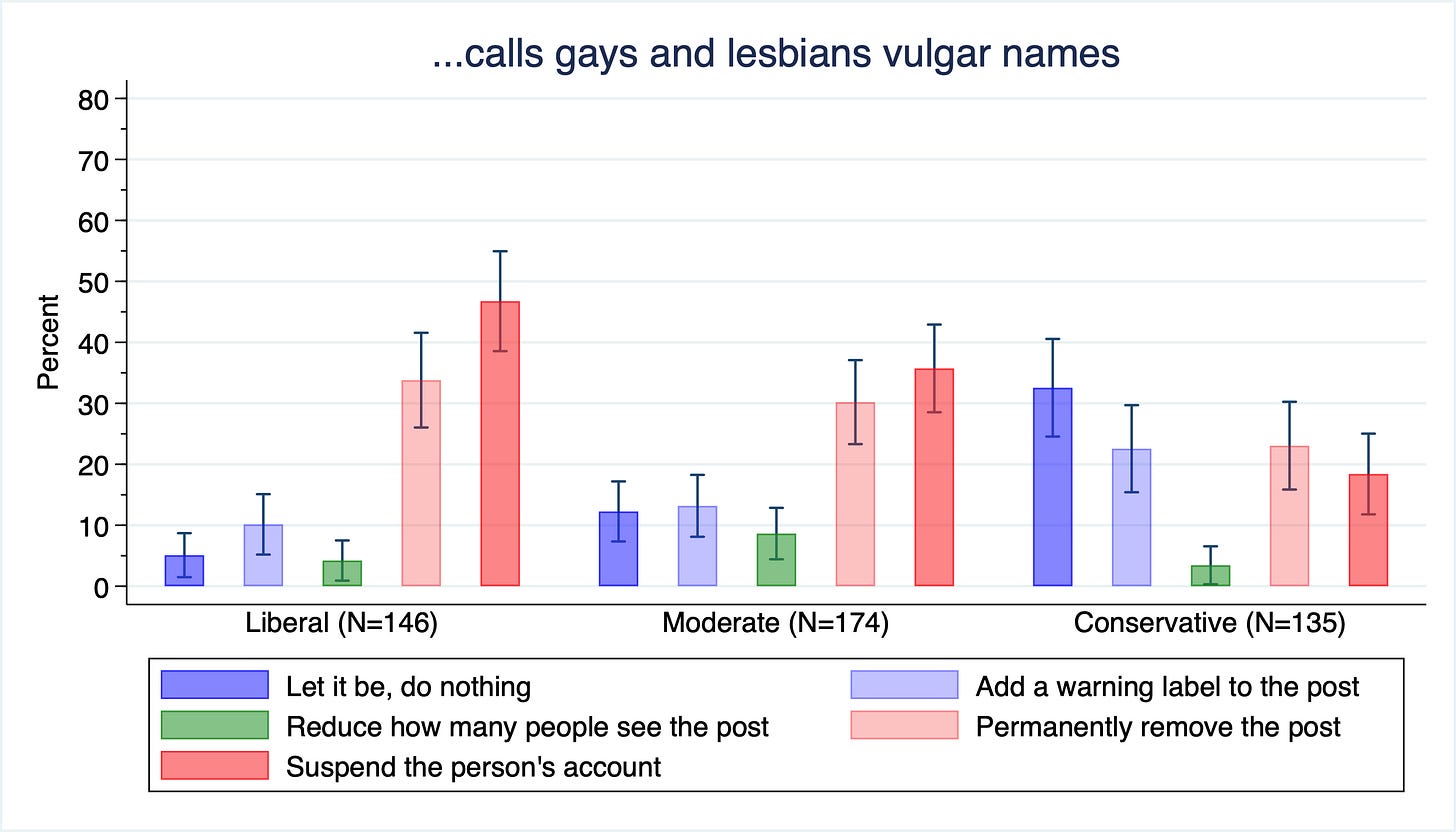
But the truth is that favoring the suppression of posts about racial differences in IQ scores is but one example of a broader censorial orientation among liberals (especially and increasingly on race). And, at least in the current data, this tendency is less ideologically symmetrical than one might expect—that is, conservatives aren’t inclined to censor ‘problematic’ left-wing-oriented speech to the same degree. The table below illustrates this by listing, for each item, the share of respondents in each group that support social media companies either doing ‘nothing’ or prefer that they permanently delete the post or suspend the poster’s account (graphs of responses to each individual item can be found in the appendix at the bottom). In only one case—the sharing of pornography—do a majority of conservatives (67.4%) favor one of the latter two courses of action. In contrast, a majority of liberals favor the permanent removal or suspension of a poster’s accounts in half (11) of all cases. Interestingly, conservatives are even more tolerant than liberals of posts that say that ‘white people are disgusting’ (54% vs. 31.4%); and those asserting that ‘violence is the only way to end white supremacy’ (36.7% vs. 12.4%). Meanwhile, only a minority of liberals prefer that social media companies do ‘nothing’ with respect to, inter alia, posts calling for the deportation of all illegal immigrants (27.9%; which, whether you agree with it or not, was a legitimate political position up until a few years ago), those questioning the effectiveness of mask-wearing (12.7%), denying climate change (11.6%), and those attributing transgenderism to mental illness. Refuse to adopt a transgender person’s preferred pronouns in your tweets? Just 31% of liberals (if they had it their way) would prefer that you be left alone, while an even larger (36.1%) share would want social media companies to take suppressive action.
Table 1. Social media censorship preferences by ideological self-placement
Note. Data are weighted. Estimates are rounded to the nearest decimal place. Group samples sizes vary by item.
Overall, and referring to Figure 2 below, liberal respondents favored a ‘do nothing’ approach for an average of 18% (median=20%) of the items assigned to them as compared to a rate of 51.4% (median=40%) among conservatives.
Figure 2. Average proportion of ‘do nothing’ and ‘remove/suspend’ responses by ideological self-placement
Note. Data are weighted. Bars represent the average share of randomly assigned items for which respondents selected a ‘do nothing’ or ‘remove/suspend’ response.
For those interested in seeing this breakdown by race/ethnicity (nothing too exciting here, so I’ll just provide the graph):
Figure 3. Average proportion of ‘do nothing’ and ‘remove/suspend’ responses by ideological self-placement x race/ethnicity.
Note. Data are weighted. Bars represent the average share of randomly assigned items for which respondents selected a ‘do nothing’ or ‘remove/suspend’ response.
Finally, though ideological differences in the rates of these responses persist regardless of sex, female respondents do tend to be significantly more censorial than their male counterparts. To be clear, this is unlikely to be an artifact of the current sample. Indeed, the gender gap in support for censorship and freedom of speech has been noted elsewhere, with some researchers attributing it to sex differences in interpersonal harm-avoidance, empathy, and other-oriented injustice sensitivity. Needless to say, and for better or worse, the feminization of American society—particularly the increasing predominance of women on college campuses and in academia—likely has consequences for the scope of free expression therein. But that’s a discussion (or article) for another day.
Figure 4. Average proportion of ‘do nothing’ and ‘remove/suspend’ responses by ideological self-placement x sex
Note. Data are weighted. Bars represent the average share of randomly assigned items for which respondents selected a ‘do nothing’ or ‘remove/suspend’ response.
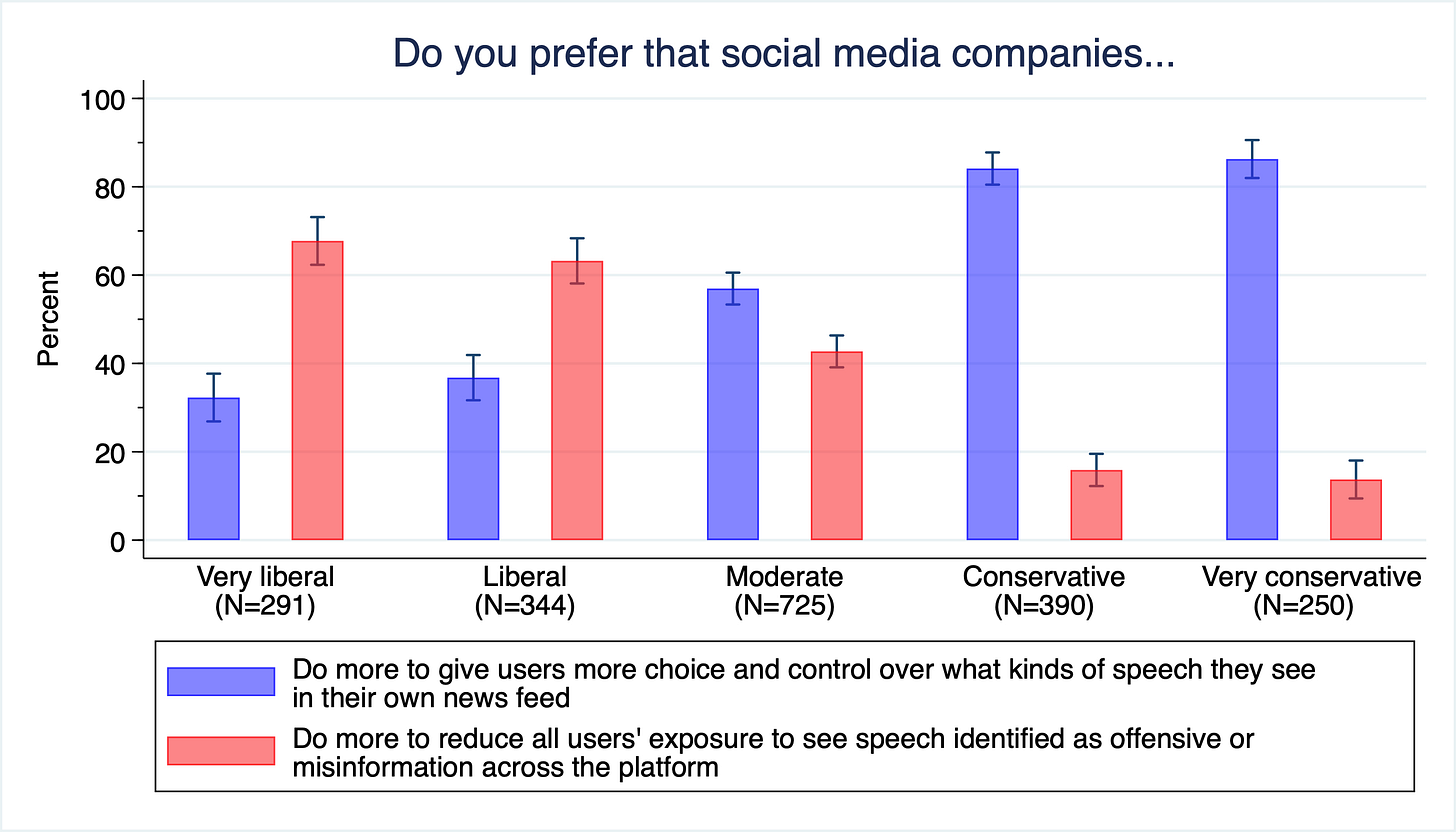
One solution that, at least on its face, would seem to make everyone happy is for social media companies to afford users greater control over the kinds of things they see in their own news feed (i.e., don’t like what you see? You can change or avoid the channel!) However, this idea is apparently far more popular among conservatives (85%) than liberals (35%), with a clear majority (65.3%) of the latter preferring that social media sites do more to reduce “all users’ exposure to see speech identified as offensive or misinformation” across their platforms. Indeed (note: at this point, I’m graph-fatigued so you’ll have to just trust me on the numbers for now) liberals (77% vs. 17.4% of conservatives) are overwhelmingly more concerned that “social media companies won’t do enough to stop the spread of false or misleading information” than they are about the risk that social media companies “will censor truth or legitimate debate and opinion from their platforms” (23.3% vs. 82.5% of conservatives). Even if such efforts “accidentally censored truthful information and legitimate debate”, 67.5% of liberals (17.7% of conservatives) would still prefer that companies stop misinformation from being shared. Eighty-two percent of conservatives, in contrast, are prepared to accept the sharing of false information for the sake of ensuring that companies “avoid censoring truthful information and legitimate debate”.
Figure 5.
But who is to decide what is false information vs. legitimate speech and debate? Social media companies? Third-party fact-checkers? Or the government? For 72% of liberal respondents (vs. 26.3% of conservatives), the answer is third-party fact-checkers (most conservatives, on the other hand, apparently reject the premise of the question, with 65% selecting none of the above). As one might expect, and dovetailing with their high degree of trust in the mainstream media, liberals place a lot more faith in the objectivity and even-handedness of fact-checkers than do conservatives. At least with respect to Facebook, 55% of liberals (vs. 15% conservatives) think that the social media company’s fact-checkers are ‘fair and objective’ (after all, the facts/truth merely have a liberal bias!) whereas 85% of conservatives suspect that their assessments are subject to political motivations and biases.
Concluding Thoughts
I don’t know about you, but I’m personally more concerned about the ‘fact-checker’ suppression of (politically inconvenient) empirical facts than I am about people sharing and heeding the recommendation of drinking bleach to treat Covid (and thereafter exiting the gene pool). Alas, if the data presented here are reliable (and here is me hoping they aren’t), there appears to be an alarming paternalistic hunger on the Left for babysitting the public and applying parental controls to our engagement with reality. And given the increasing hold of woke and safetyist sensibilities over the institutions and corporations that regulate or at least tremendously influence the flow of information, my fear is that the babysitters will ultimately (or perhaps already have) prevail.
Future research directions with this dataset
So it turns out that the Cato survey actually fielded 3 items that deal with mental health (one on diagnoses, and two that measure symptoms of depression/anxiety). How might mental health be related to censorship preferences? Is it independently predictive of them? Or is any such relationship merely coincidental (perhaps the product of both variables’ relationships with ideological liberalism)? Stay tuned for a follow-up post that gets at these questions in the coming weeks (or whenever I’m able to get around to it).
Appendix.






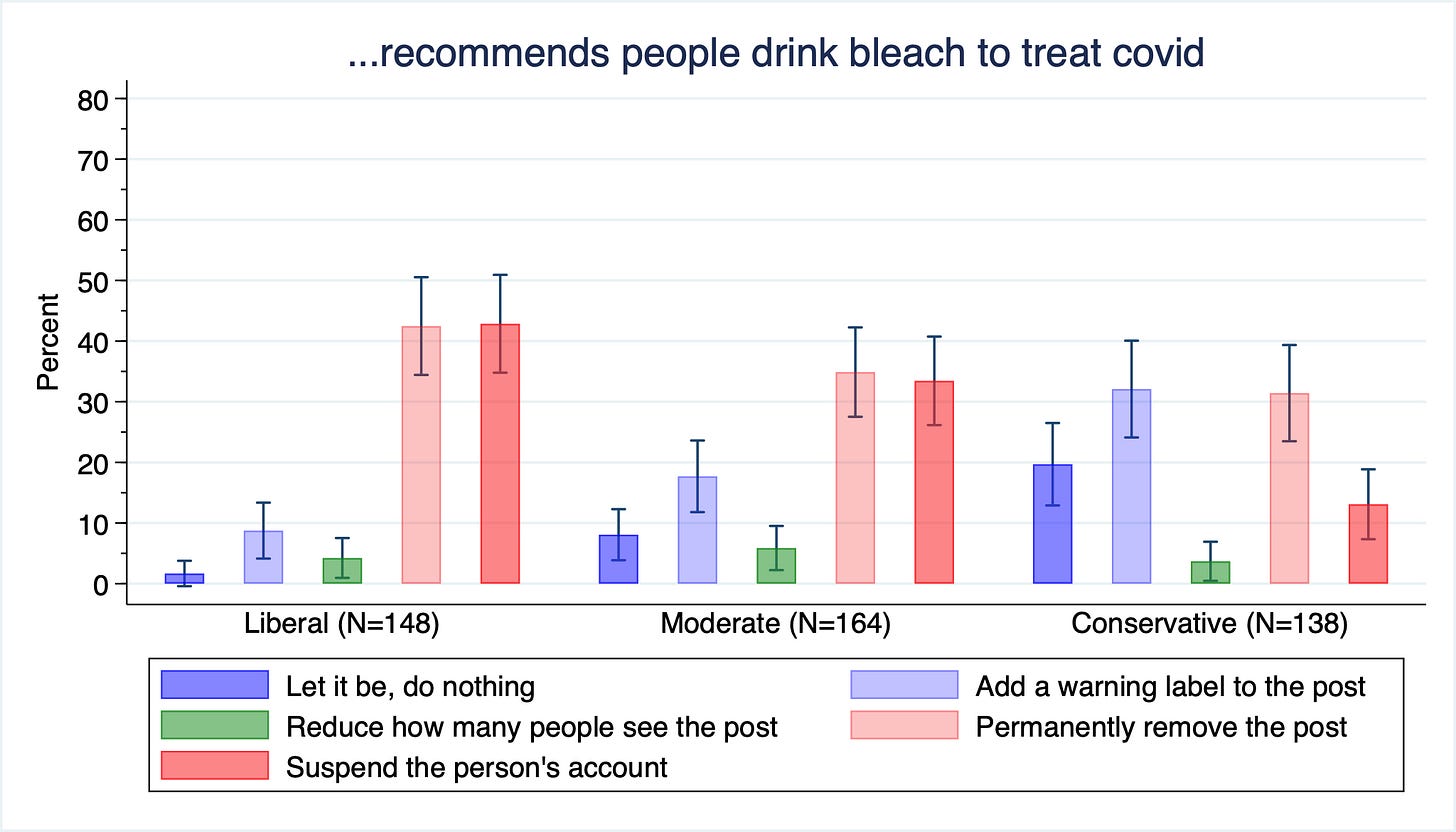


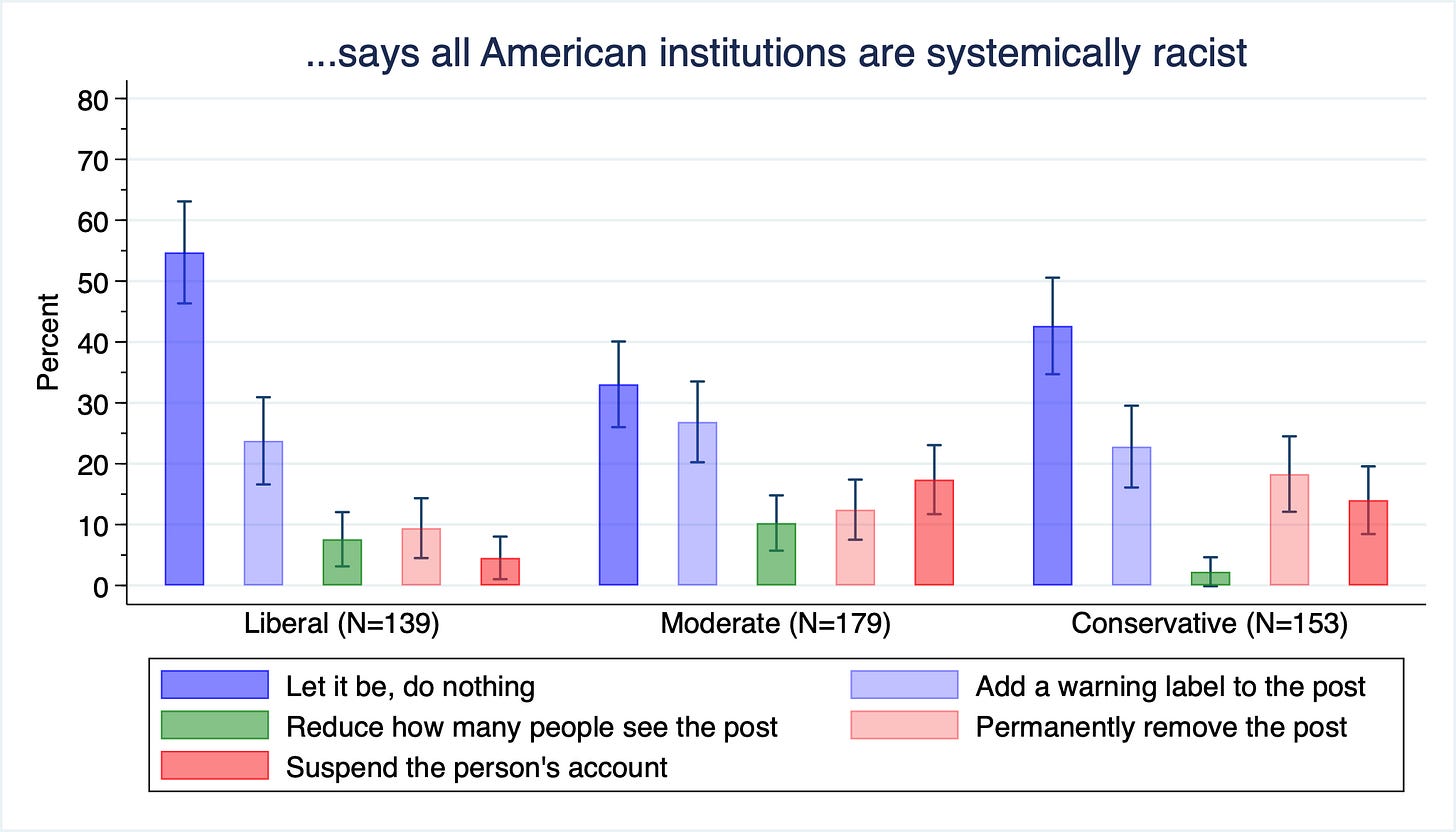


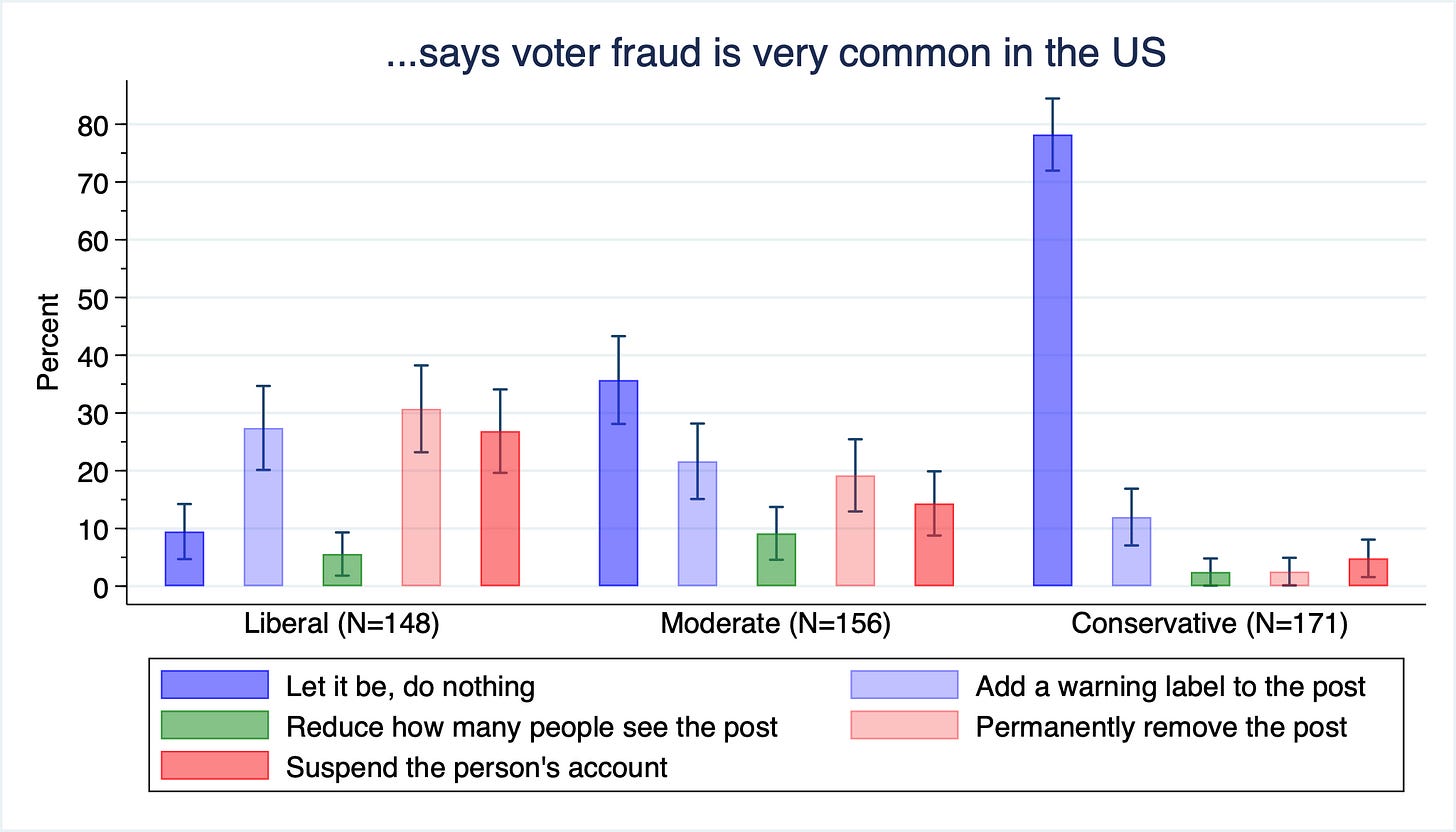


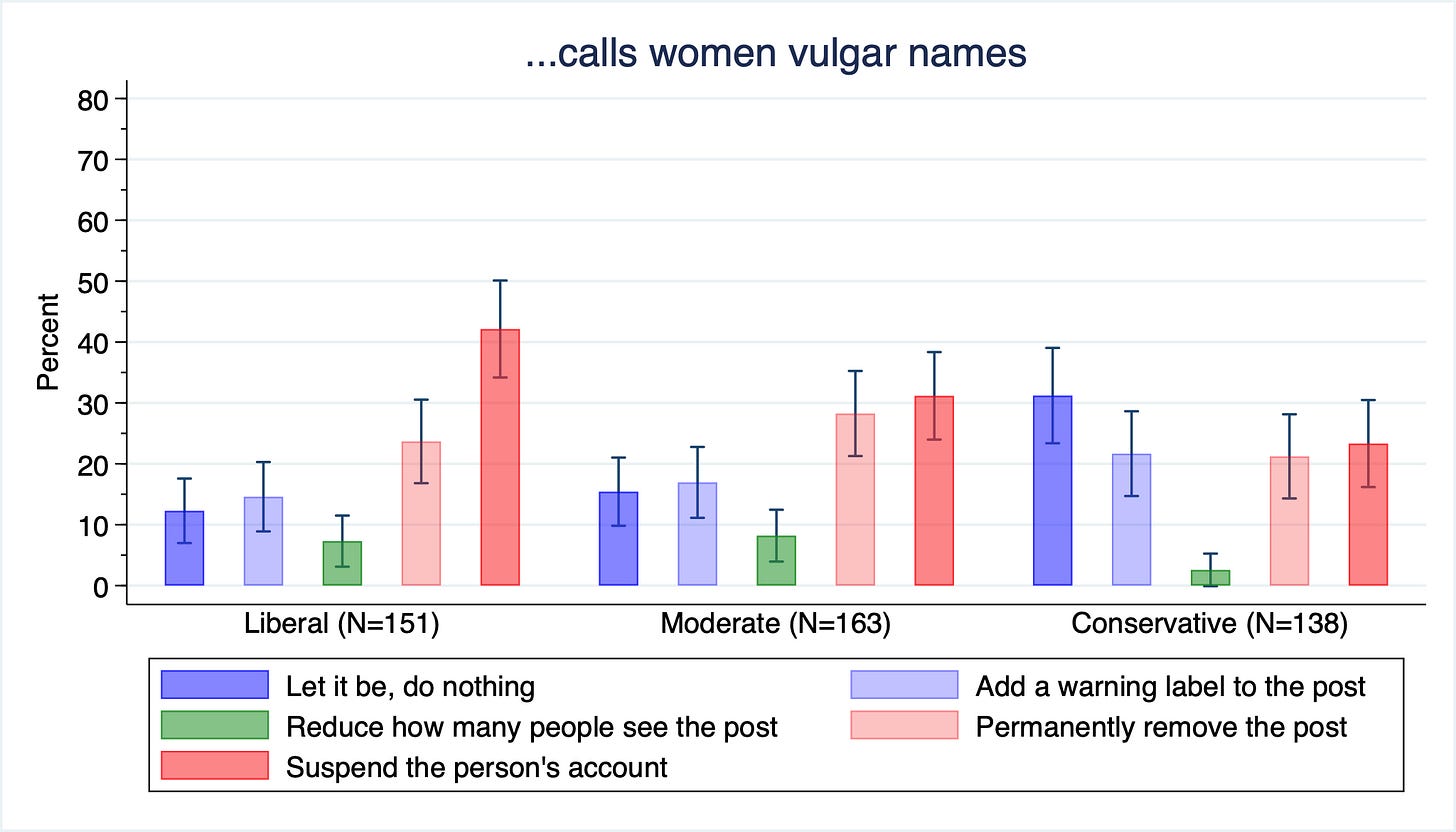
Thank you for visualizing all this data! I got linked to this analysis, so I want to add some things that came to mind in the course of reading it since it's an ongoing discussion.
1. Closed Data is Not Great
The data suggesting that ~40% of moderates believe flag burning should result in content removal and bans seems questionable. Without transparency regarding the methodology, it's difficult to assess the validity of these findings. Robust conclusions require a clear understanding of how variables were controlled. This lack of transparency undermines the reliability of the analysis.
2. Who is Doing The Censoring Matters
Referencing this XKCD comic: https://xkcd.com/1357/, it's important to remember that censorship by the government is widely seen as dangerous, irrespective of political beliefs. The data in this article focuses on social media platforms, which many view as private entities with the right to moderate content, akin to deciding what's permissible in one's own home. While it can be argued that social media is a public space, not everyone understands the distinction and thus something to keep in mind.
3. Many of The Questions Seem Weighted
I love some of the baseline questions, such as those on flag burning or defunding the police, where the answer should heavily lean towards "do not censor". It would be interesting to see even more universally agreeable topics so we can use them as a litmus test to make sure respondents' understand their own thought processes. However, the current questions seem skewed towards challenging liberal viewpoints, which raises three concerns.
First, when categorizing the questions, most seem to target issues of disinformation or discrimination. This raises the question: are we measuring a general tendency to support censorship, or simply highlighting that liberals oppose these issues? It's essential to recognize that society already accepts certain forms of censorship, such as cursing on TV, slander, incitement (e.g. mass shooters, specific calls to action), copyright violations, gore, nudity, and so forth. Even stuff like laws and things like the 13th amendment shape what you can and cannot say and do without repercussion. While it’s a slippery slope, a few carve-outs don't necessarily lead to authoritarianism.
Second, grouping questions by potential emotional impact reveals an imbalance, favoring issues more likely to upset liberals. Including topics that resonate more with conservative concerns, such as religion, gun rights, and “traditional topics” (e.g. national security), might produce more balanced responses and reveal different censorship tendencies.
Third, it's understandable that people react more strongly to immediate threats like COVID-19 vaccine misinformation compared to symbolic acts like flag burning. The potential loss of a loved one due to misinformation (natural selection, IMO) is far more tangible and distressing than abstract concerns about national symbols, highlighting the varying degrees of investment in different censorship issues.
In conclusion, we should consider these issues in a broader context. While the article presents valid points, the reality is likely more nuanced. People will always attempt to twist narratives to suit their interests, regardless of the group. Understanding those behaviors and educating one another is more valuable in navigating censorship discussions than pointing fingers.
I acknowledge the article covers various aspects, but I wanted to address specific points that seemed problematic and explore the underlying reasons.
Well done. Very thorough! I also had graph fatigue by the time I reached the point of you commenting about it.
But is this really good, unbiased data? Because if it is, then holy $%* $?#* what happened to the political left? Remember the ACLU? The Berkely Free Speech Movement? Remember stoned dudes with long hair who just wandered around telling you random stuff? Remember? Anybody?